Custom Azure Application Insights Telemetry Metrics with .NET
By default, Azure Application Insights comes with necessary and important telemetry capabilities to monitor the basic functions of an application and collect telemetry.
In almost all cases, however, it is necessary or at least advisable that custom metrics are also collected and transmitted to Application Insights in order to understand and monitor the functionality of an application.
App Insights Custom Events
Custom metrics can be collected in Azure Application Insights via custom events. A custom event is an event that is triggered by an application and sent to Application Insights. A custom event can also contain additional data that can be used for analysis and visualization in Application Insights.
The SDK provides the following APIs:
TrackEvent- Sends a custom event to Application Insights.TrackMetric- Sends a user-defined metric to Application Insights.TrackTrace- Sends a custom track to Application Insights.TrackException- Sends a custom exception to Application Insights.TrackRequest- Sends a custom request to Application Insights.TrackDependency- Sends a user-defined dependency to Application Insights.
The latter is the variant we are particularly interested in for our Custom Metrics request. This not only allows me to monitor how individual code blocks are executed, but also monitor the duration so that I can identify performance or runtime problems.
Custom Dependency
The Custom Dependency is a direct functionality of the Telemetry Client and can be easily used through Dependency Injection as soon as Application Insights has been registered accordingly.
public class MyClass
{
    private readonly TelemetryClient _telemetryClient;

    public MyClass(TelemetryClient telemetryClient)
    {
        _telemetryClient = telemetryClient;
    }

    public async Task MyMethod()
    {
       string operationName = nameof(MyMethod);

       IOperationHolder<DependencyTelemetry> aiOperation =
          _telemetryClient.StartOperation<DependencyTelemetry>(operationName);

       try
       {
            // await  ... my actual code

            aiOperation.Telemetry.Success = true;
       }
       catch(Exception e)
       {
            aiOperation.Telemetry.Success = false;
            _telemetryClient.TrackException(e);

            throw;
       }
       finally
       {
            _telemetryClient.StopOperation(aiOperation);
       }
    }
}
We therefore have an OperationHolder that contains the Telemetry information. This is started by StartOperation and ended by StopOperation. If our code is executed successfully, the client is informed that the operation was successful and the TrackException also transmits the exception to Application Insights in the event of an error.
In this example, tracking is directly part of the method, but depending on the architecture of the application, it should take place in a middleware or another central point of the application. If you use MediatR as an application engine, you can implement this using a Behavior.
Own Monitoring Implementation
To enable tracking in your own context, I have created this simplified implementation (optimized accordingly in my code, kept simple here):
public class DepenencyOperationMonitor
{
    private readonly TelemetryClient _telemetryClient;

    public DepenencyOperationMonitor(TelemetryClient telemetryClient)
    {
        _telemetryClient = telemetryClient;
    }

    public async Task<T> ExecuteAsync<T>(Func<Task<T>> action, string operationName)
    {
        using  IOperationHolder<DependencyTelemetry> aiOperation =
            _telemetryClient.StartOperation<DependencyTelemetry>(operationName);

        try
        {
            T response = await action().ConfigureAwait(false);

            // no exception = succeeded
            aiOperation.Telemetry.Success = true;

            return response;
        }
        catch (Exception e)
        {
            aiOperation.Telemetry.Success = false;
            _telemetryClient.TrackException(e);

            throw;
        }
        finally
        {
            _telemetryClient.StopOperation(aiOperation);
        }
    }
}
This OperationMonitor can now simply be registered as a singleton and injected into your own classes.
public class MyClass
{
    private readonly IDepenencyOperationMonitor _operationMonitor;

    public MyClass(IDepenencyOperationMonitor operationMonitor)
    {
        _operationMonitor = operationMonitor;
    }

    public async Task<MyResult> MyMethod()
    {
        const string operationName = $"{nameof(MyClass)}.{nameof(MyMethod)}";

        MyResult result = await _operationMonitor.ExecuteAsync(
            async () =>
            {
              // await  ... my actual code

                return myResult;
            }, operationName).ConfigureAwait(false);

        return result;
    }
Dashboard View
After the data has been sent to Application Insights, it can be viewed in the Azure Portal. Here you can see the duration of the individual operations and also filter them according to the success or failure of the operation.
For that, open your App Insights Dashboard and navigate to the Dependency Tab.
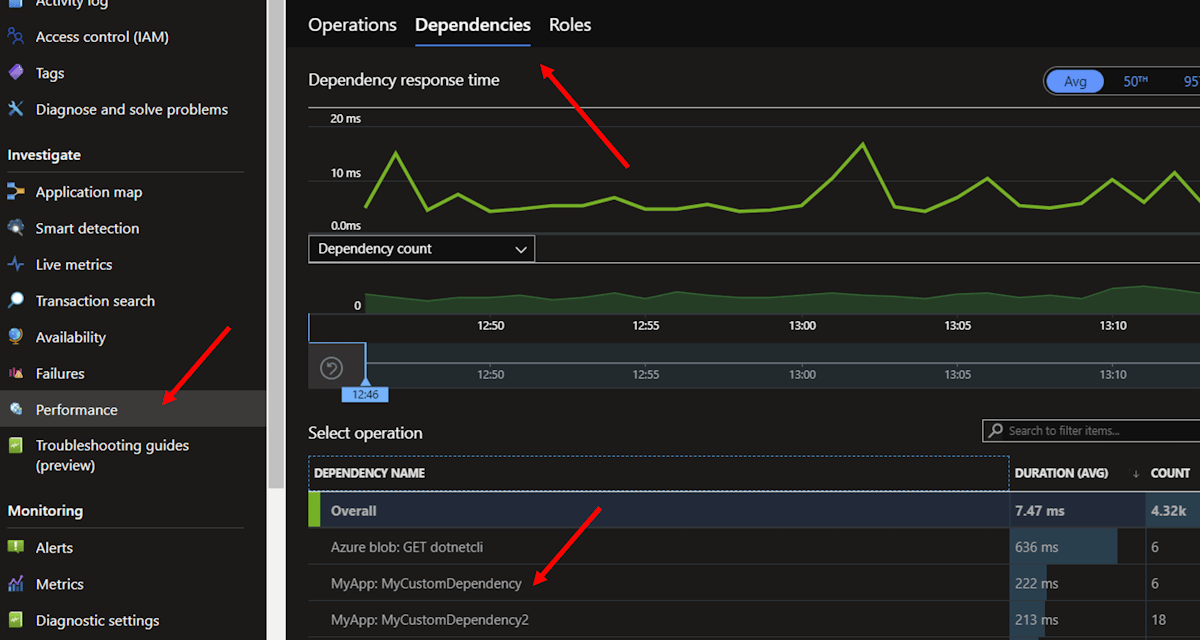
In this view you can also see that this behavior is included in many other software modules, e.g. in all Azure SDKs!
Conclusion
With the help of the TelemetryClient and the IOperationHolder we can easily monitor our own code and send the results to Application Insights. This allows us to monitor the performance of our application and identify runtime problems.
Have fun monitoring your application!
Autor

Benjamin Abt
Ben is a passionate developer and software architect and especially focused on .NET, cloud and IoT. In his professional he works on high-scalable platforms for IoT and Industry 4.0 focused on the next generation of connected industry based on Azure and .NET. He runs the largest german-speaking C# forum myCSharp.de, is the founder of the Azure UserGroup Stuttgart, a co-organizer of the AzureSaturday, runs his blog, participates in open source projects, speaks at various conferences and user groups and also has a bit free time. He is a Microsoft MVP since 2015 for .NET and Azure.